Complete Rhipicephalus microplus analysis with xnicher
Source:vignettes/rhipicephalus.Rmd
rhipicephalus.RmdIntroduction
This report shows a complete xnicher workflow for
modelling the ecological niche of the cattle tick Rhipicephalus
microplus. Two likelihood families are compared:
-
presence_only: a Gaussian ellipsoid fitted with presence points only. -
ncst: a non-central skew-t model with heavy tails and asymmetry.
The bundled dataset contains:
-
rhipicephalus: coordinates and environmental values for 334 presence records and 9,784 background points inside the accessible area . -
rhipicephalus_env.tif: a two-band raster with annual mean temperature (bio1, °C) and relative humidity (rh, %).
Load data and raster
data(rhipicephalus)

vars <- c("bio1", "rh")

# The package data frames may include an ID column from terra::extract;
# keep only the environmental variables.
env_occ  <- rhipicephalus$env_occ[, vars]
env_m    <- rhipicephalus$env_m[, vars]
coords_occ <- rhipicephalus$coords_occ
coords_m   <- rhipicephalus$coords_m

# Full two-band raster
env_stack <- rast(system.file("extdata", "rhipicephalus_env.tif",
                              package = "xnicher"))
names(env_stack) <- vars

nrow(env_occ)
#> [1] 334
nrow(env_m)
#> [1] 9784
Standardisation (z-score)
bio1 is in °C and rh is in percent. To give
both variables comparable influence in the objective — especially
important for ncst — we standardise using the mean and
standard deviation of the background
.
means <- colMeans(env_m)
sds   <- apply(env_m, 2, sd)

scale_env <- function(df) {
  df <- as.data.frame(df)
  data.frame(
    bio1 = (df$bio1 - means["bio1"]) / sds["bio1"],
    rh   = (df$rh   - means["rh"])   / sds["rh"]
  )
}

env_occ_sc <- scale_env(env_occ)
env_m_sc   <- scale_env(env_m)

summary(env_occ_sc)
#>       bio1               rh
#>  Min.   :-3.2839   Min.   :-2.7202
#>  1st Qu.:-0.7188   1st Qu.:-0.2101
#>  Median :-0.1895   Median : 0.1370
#>  Mean   :-0.2324   Mean   : 0.0858
#>  3rd Qu.: 0.2177   3rd Qu.: 0.5312
#>  Max.   : 1.0728   Max.   : 1.5415
Train/test split
Presence records are split into 65 % for training and 35 % for evaluating predictive performance.
Model fitting
Both models are fitted with 20 Sobol starts. For a final analysis,
increase num_starts to 50–100.
fit_po <- optimize_niche(
  env_occ    = train,
  env_m      = NULL,
  likelihood = "presence_only",
  num_starts = 20L,
  seed       = 123L
)

assess(fit_po)
#> $flag
#> [1] "accepted_global"
#>
#> $recommendation
#> [1] "Global optimum likely found: multiple converged starts agree closely."
#>
#> $gap
#> [1] 5.684342e-14
#>
#> $rel_gap
#> [1] 1.298082e-15
#>
#> $n_converged
#> [1] 20
#>
#> $best_loglik
#> [1] -43.79031
fit_ncst <- optimize_niche(
  env_occ    = train,
  env_m      = NULL,
  likelihood = "ncst",
  num_starts = 20L,
  seed       = 123L
)

assess(fit_ncst)
#> $flag
#> [1] "accepted_global"
#>
#> $recommendation
#> [1] "Global optimum likely found: multiple converged starts agree closely."
#>
#> $gap
#> [1] 7.389644e-13
#>
#> $rel_gap
#> [1] 2.325056e-15
#>
#> $n_converged
#> [1] 20
#>
#> $best_loglik
#> [1] -317.8266
Information-criteria comparison
cmp <- compare_xnicher(presence_only = fit_po, ncst = fit_ncst)
cmp[, c("model", "likelihood", "df", "loglik", "AIC", "BIC", "convergence")]
#>           model    likelihood df     loglik       AIC      BIC convergence
#> 1 presence_only presence_only  5  -43.79031  97.58063 114.4801           1
#> 2          ncst          ncst  8 -316.01525 648.03049 675.0697           1
TSS on the test set
The True Skill Statistic (TSS) is computed with a background sample of the same size as the test presences.
compute_tss <- function(suit_pres, suit_bg) {
  vals <- c(suit_pres, suit_bg)
  lab  <- c(rep(1, length(suit_pres)), rep(0, length(suit_bg)))
  ok   <- is.finite(vals)
  if (sum(ok) == 0) return(c(tss = NA_real_, threshold = NA_real_))
  vals <- vals[ok]
  lab  <- lab[ok]
  np   <- sum(lab == 1)
  nb   <- sum(lab == 0)
  if (np == 0 || nb == 0) return(c(tss = NA_real_, threshold = NA_real_))
  if (nb > np) {
    set.seed(123)
    vals_bg   <- vals[lab == 0]
    vals_pres <- vals[lab == 1]
    vals_bg   <- sample(vals_bg, size = np, replace = FALSE)
    vals      <- c(vals_pres, vals_bg)
    lab       <- c(rep(1, np), rep(0, np))
    nb        <- np
  }
  thresholds <- sort(unique(vals), decreasing = TRUE)
  thresholds <- c(thresholds, min(thresholds, na.rm = TRUE) - 1)
  tss_vec <- vapply(thresholds, function(t) {
    pred <- as.integer(vals > t)
    sens <- sum(pred[lab == 1]) / np
    spec <- sum(1 - pred[lab == 0]) / nb
    sens + spec - 1
  }, numeric(1))
  best <- which.max(tss_vec)
  c(tss = tss_vec[best], threshold = thresholds[best])
}
A raster cropped to the study area is standardised with the same parameters used during training and then projected with each fitted model.
cm <- coords_m
e  <- ext(min(cm$lon) - 5, max(cm$lon) + 5,
          min(cm$lat) - 5, max(cm$lat) + 5)

env_crop <- crop(env_stack, e)
env_crop[["bio1"]] <- (env_crop[["bio1"]] - means["bio1"]) / sds["bio1"]
env_crop[["rh"]]   <- (env_crop[["rh"]]   - means["rh"])   / sds["rh"]
env_crop <- env_crop[[vars]]

# Geographic projections
suit_po   <- predict(fit_po,   env_crop, threads = 1)
suit_ncst <- predict(fit_ncst, env_crop, threads = 1)
Suitability values at test and background points are extracted. Some
versions of terra keep an ID column even with
ID = FALSE, so the layer name suitability is
used explicitly.
v_test <- vect(test_coords, geom = c("lon", "lat"), crs = "EPSG:4326")
v_bg   <- vect(coords_m,    geom = c("lon", "lat"), crs = "EPSG:4326")

s_test_po <- terra::extract(suit_po,   v_test)$suitability
s_bg_po   <- terra::extract(suit_po,   v_bg)$suitability
s_test_nc <- terra::extract(suit_ncst, v_test)$suitability
s_bg_nc   <- terra::extract(suit_ncst, v_bg)$suitability

tss_po   <- compute_tss(s_test_po,   s_bg_po)
tss_ncst <- compute_tss(s_test_nc,   s_bg_nc)

knitr::kable(data.frame(
  model     = c("presence_only", "ncst"),
  TSS       = c(tss_po["tss"],   tss_ncst["tss"]),
  threshold = c(tss_po["threshold"], tss_ncst["threshold"]),
  row.names = NULL
), digits = 4)| model | TSS | threshold |
|---|---|---|
| presence_only | 0.2564 | 0.2681 |
| ncst | 0.3333 | 0.4253 |
Iso-suitability in environmental space
bg_sample <- env_m_sc[sample.int(nrow(env_m_sc), 3000), ]

p_po <- ggplot() +
  geom_xnicher_background(bg_sample) +
  geom_xnicher_occ(env_occ_sc, colour = "black", size = 0.8, alpha = 0.4) +
  geom_xnicher_isosuitability(fit_po,
                              level = c(0.95, 0.75, 0.5, 0.25, 0.05),
                              colour = "firebrick") +
  labs(title = "presence_only: bio1 x rh",
       x = "bio1 (z-score)", y = "rh (z-score)")

p_ncst <- ggplot() +
  geom_xnicher_background(bg_sample) +
  geom_xnicher_occ(env_occ_sc, colour = "black", size = 0.8, alpha = 0.4) +
  geom_xnicher_isosuitability(fit_ncst,
                              level = c(0.95, 0.75, 0.5, 0.25, 0.05),
                              colour = "steelblue") +
  labs(title = "ncst: bio1 x rh",
       x = "bio1 (z-score)", y = "rh (z-score)")

print(p_po)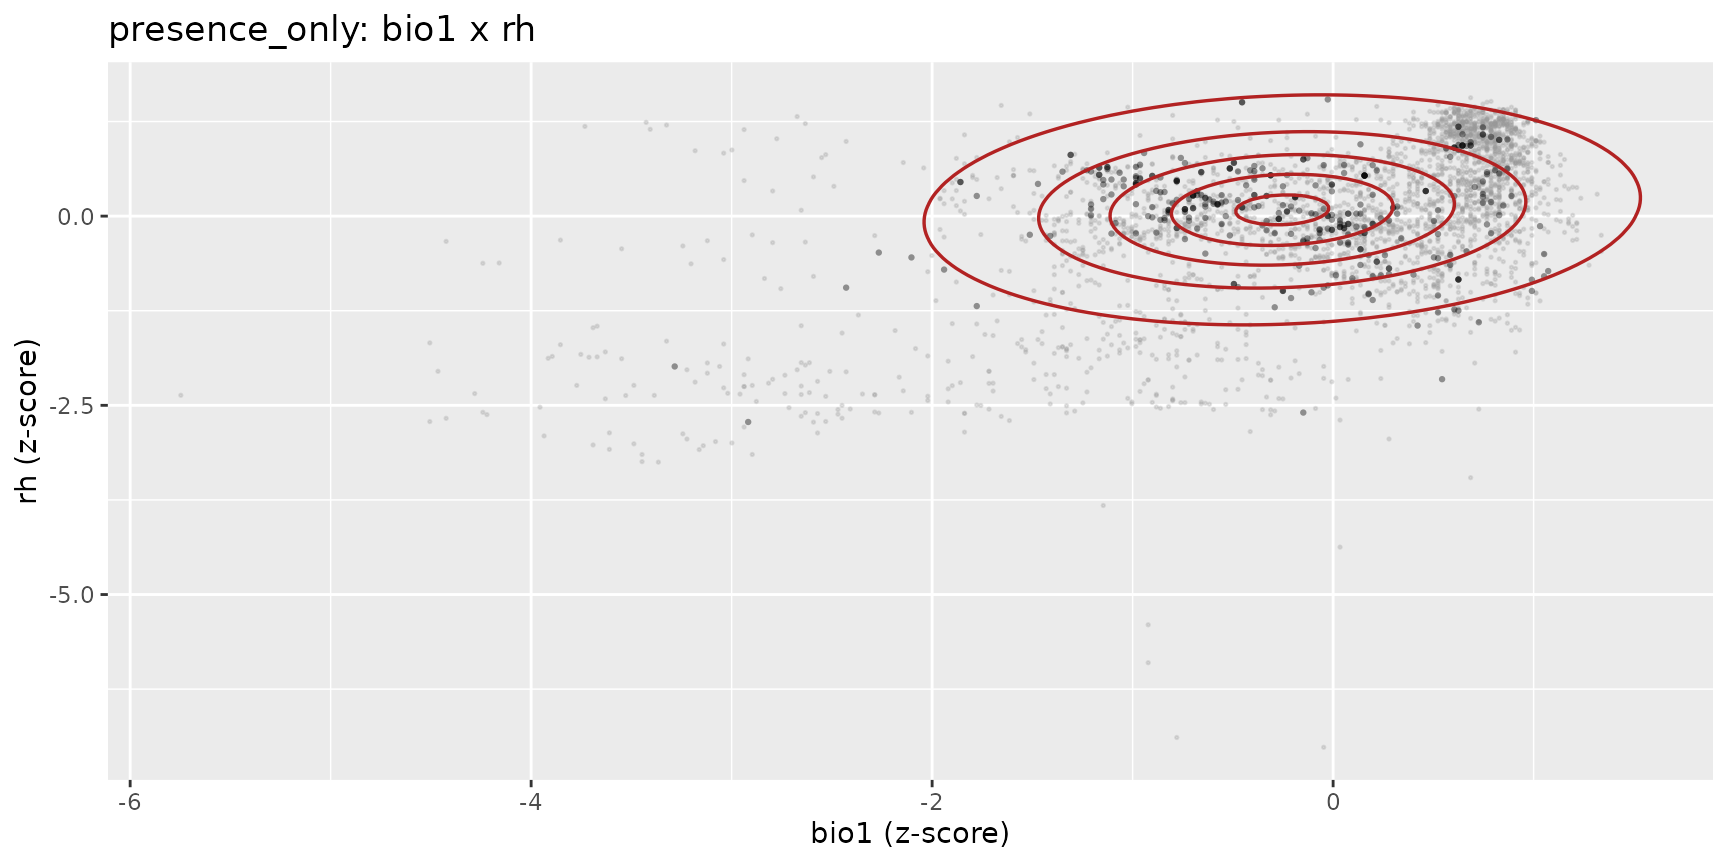
print(p_ncst)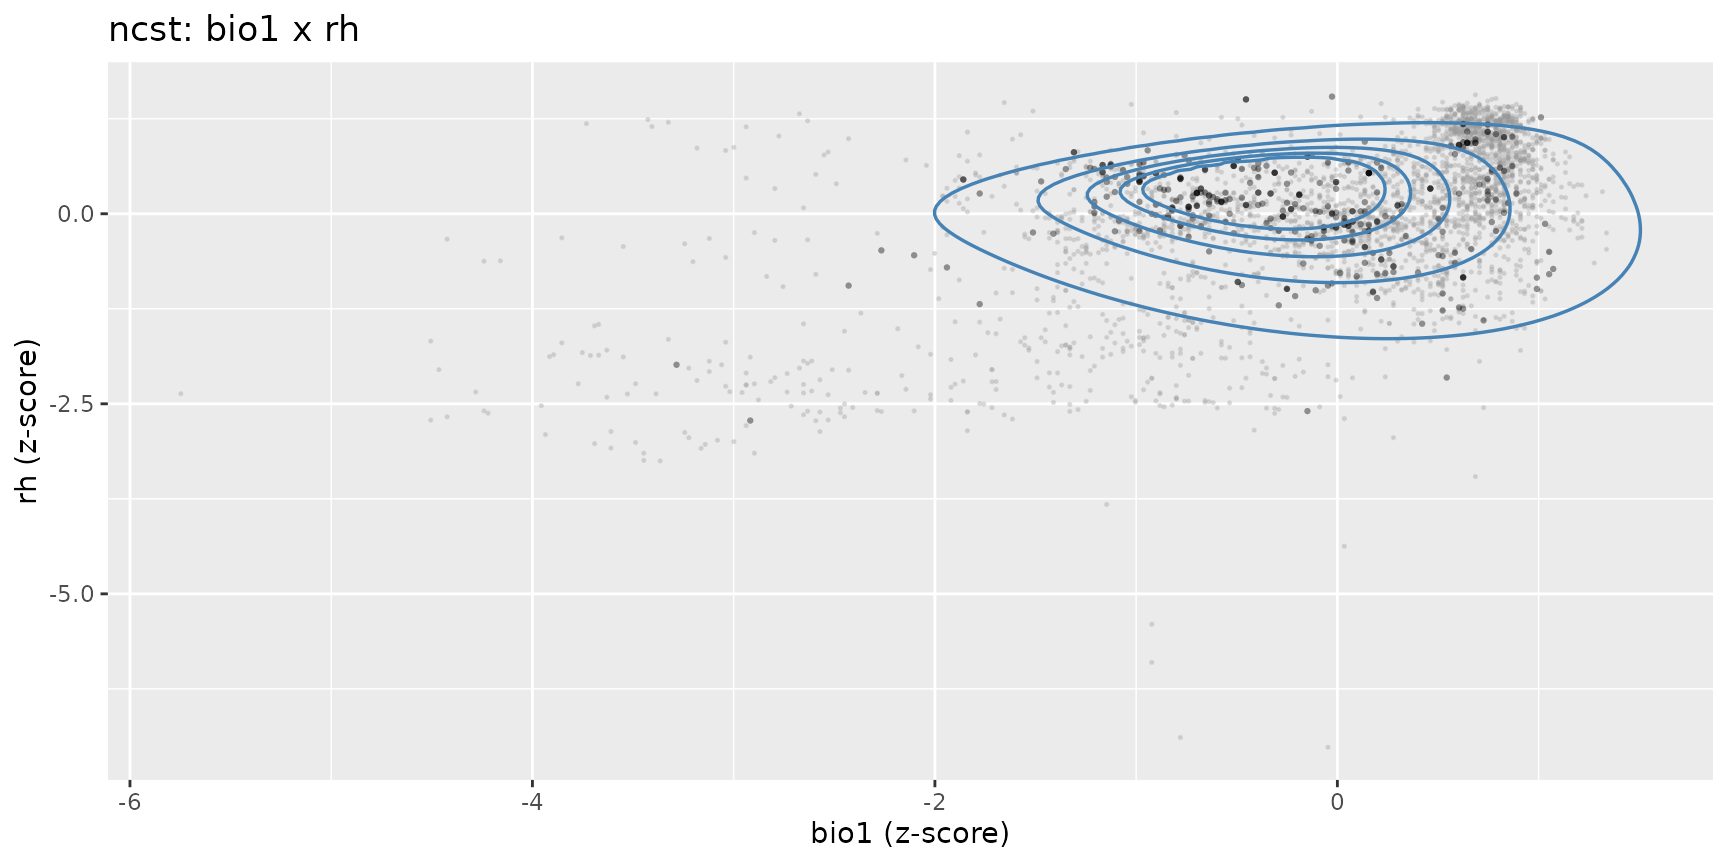
Geographic suitability maps
op <- par(mfrow = c(1, 2), mar = c(3, 3, 3, 5))

plot(suit_po, main = "presence_only: suitability",
     range = c(0, 1), col = hcl.colors(100, "YlOrRd"))
points(test_coords$lon, test_coords$lat, pch = 4, cex = 0.5, col = "blue")

plot(suit_ncst, main = "ncst: suitability",
     range = c(0, 1), col = hcl.colors(100, "YlOrRd"))
points(test_coords$lon, test_coords$lat, pch = 4, cex = 0.5, col = "blue")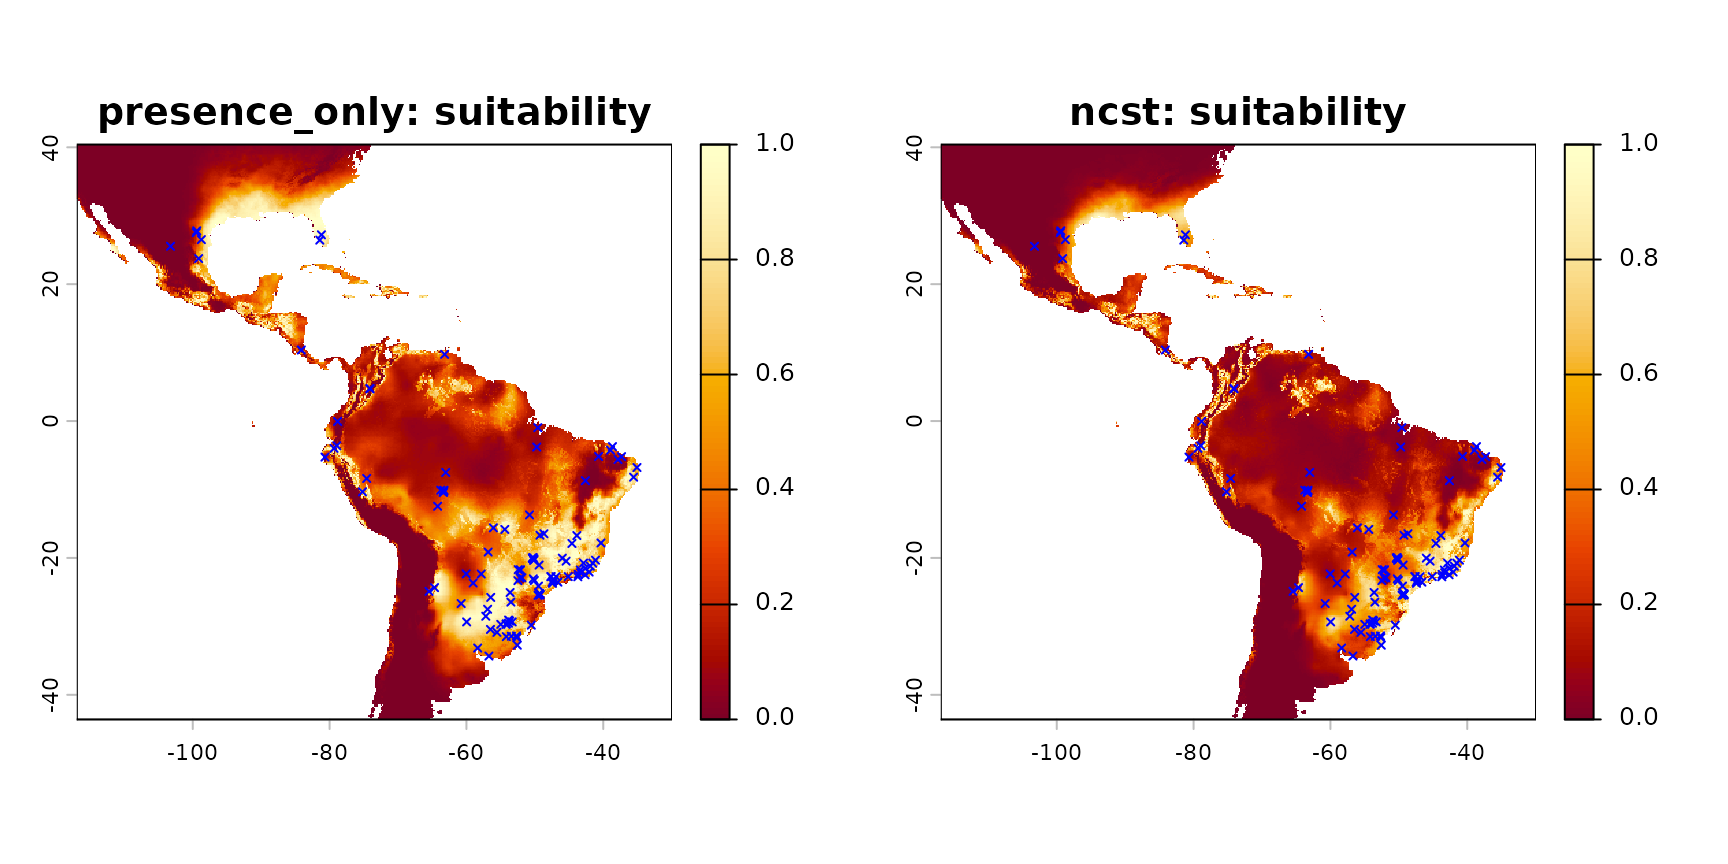
par(op)Binary maps using the TSS threshold
suit_bin_po   <- suit_po   > tss_po["threshold"]
suit_bin_ncst <- suit_ncst > tss_ncst["threshold"]

op <- par(mfrow = c(1, 2), mar = c(3, 3, 3, 5))

plot(suit_bin_po, main = "presence_only: presence / absence",
     col = c("white", "firebrick"), legend = FALSE)
points(test_coords$lon, test_coords$lat, pch = 4, cex = 0.5, col = "blue")

plot(suit_bin_ncst, main = "ncst: presence / absence",
     col = c("white", "steelblue"), legend = FALSE)
points(test_coords$lon, test_coords$lat, pch = 4, cex = 0.5, col = "blue")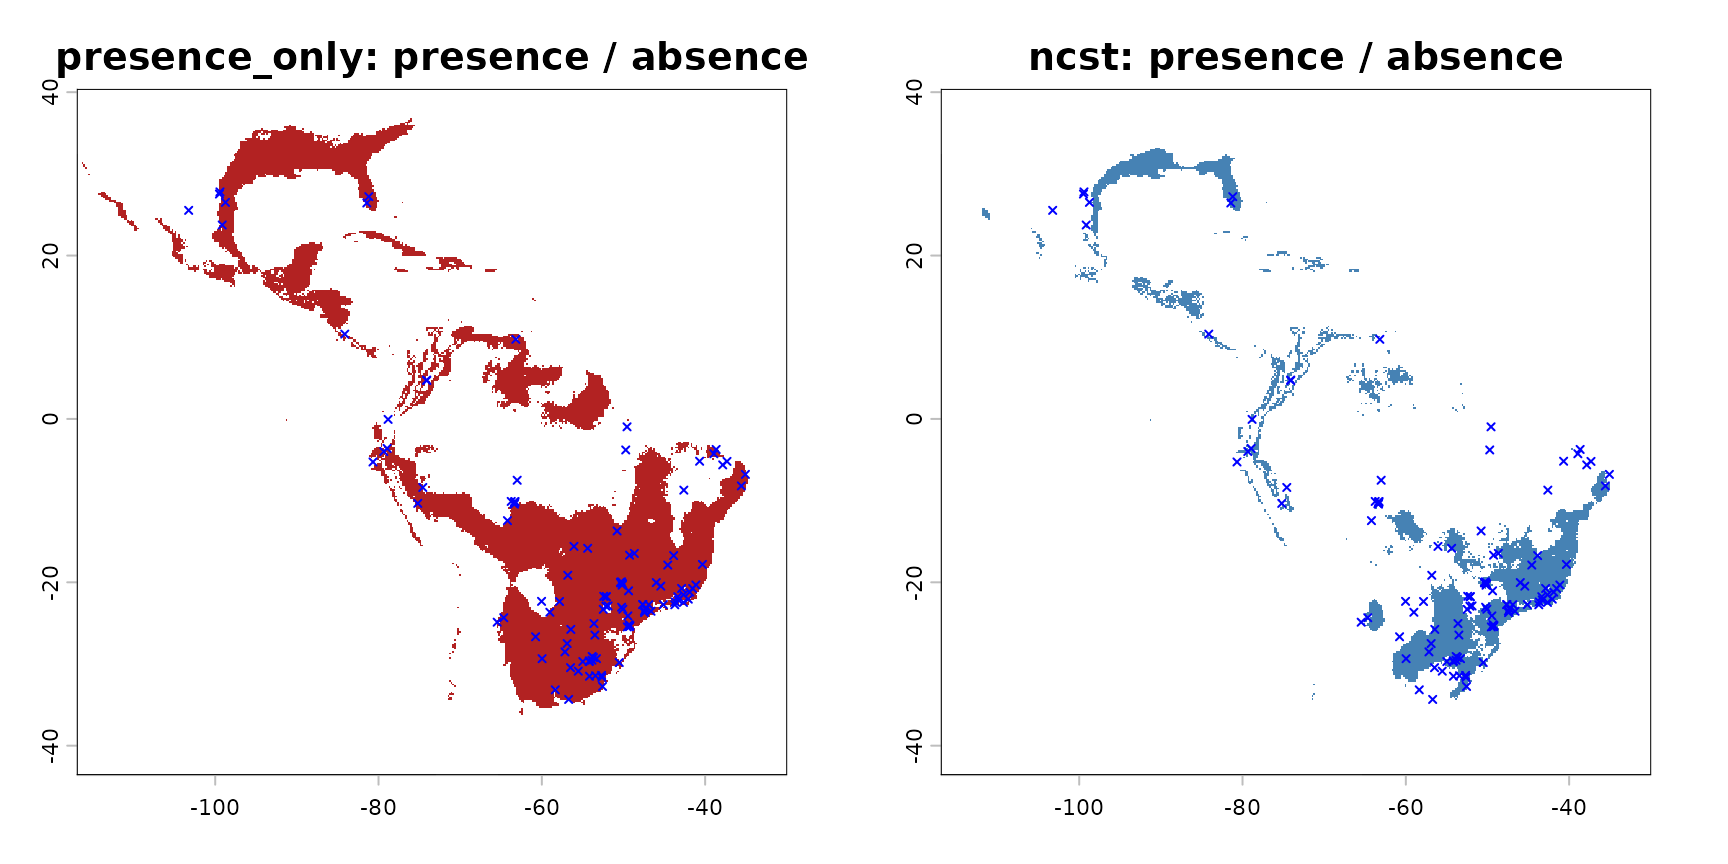
par(op)Summary and conclusions
resumen <- data.frame(
  model         = c("presence_only", "ncst"),
  AIC           = c(AIC(fit_po),   AIC(fit_ncst)),
  BIC           = c(BIC(fit_po),   BIC(fit_ncst)),
  TSS_test      = c(tss_po["tss"], tss_ncst["tss"]),
  TSS_threshold = c(tss_po["threshold"], tss_ncst["threshold"]),
  convergence   = c(fit_po$best$convergence, fit_ncst$best$convergence)
)

knitr::kable(resumen, digits = 4)| model | AIC | BIC | TSS_test | TSS_threshold | convergence |
|---|---|---|---|---|---|
| presence_only | 97.5806 | 114.4801 | 0.2564 | 0.2681 | 1 |
| ncst | 648.0305 | 675.0697 | 0.3333 | 0.4253 | 1 |
- The
presence_onlymodel has a much lower BIC/AIC, indicating a more parsimonious fit for this dataset. - The
ncstmodel reaches a slightly higher TSS (greater discriminative power on the test set), but the gain does not compensate for the extra parameter penalty. - The R. microplus presence cloud is fairly symmetric in
standardised environmental space, so the Gaussian ellipsoid already
describes the niche well. The additional skewness / heavy-tail
flexibility of
ncstdoes not improve the likelihood enough to be preferred.
If the goal is spatial prediction, ncst
may still be useful when tested with more starts or when robustness to
heavy tails is required. If the goal is parsimonious model
selection, presence_only is the best choice with
these data.