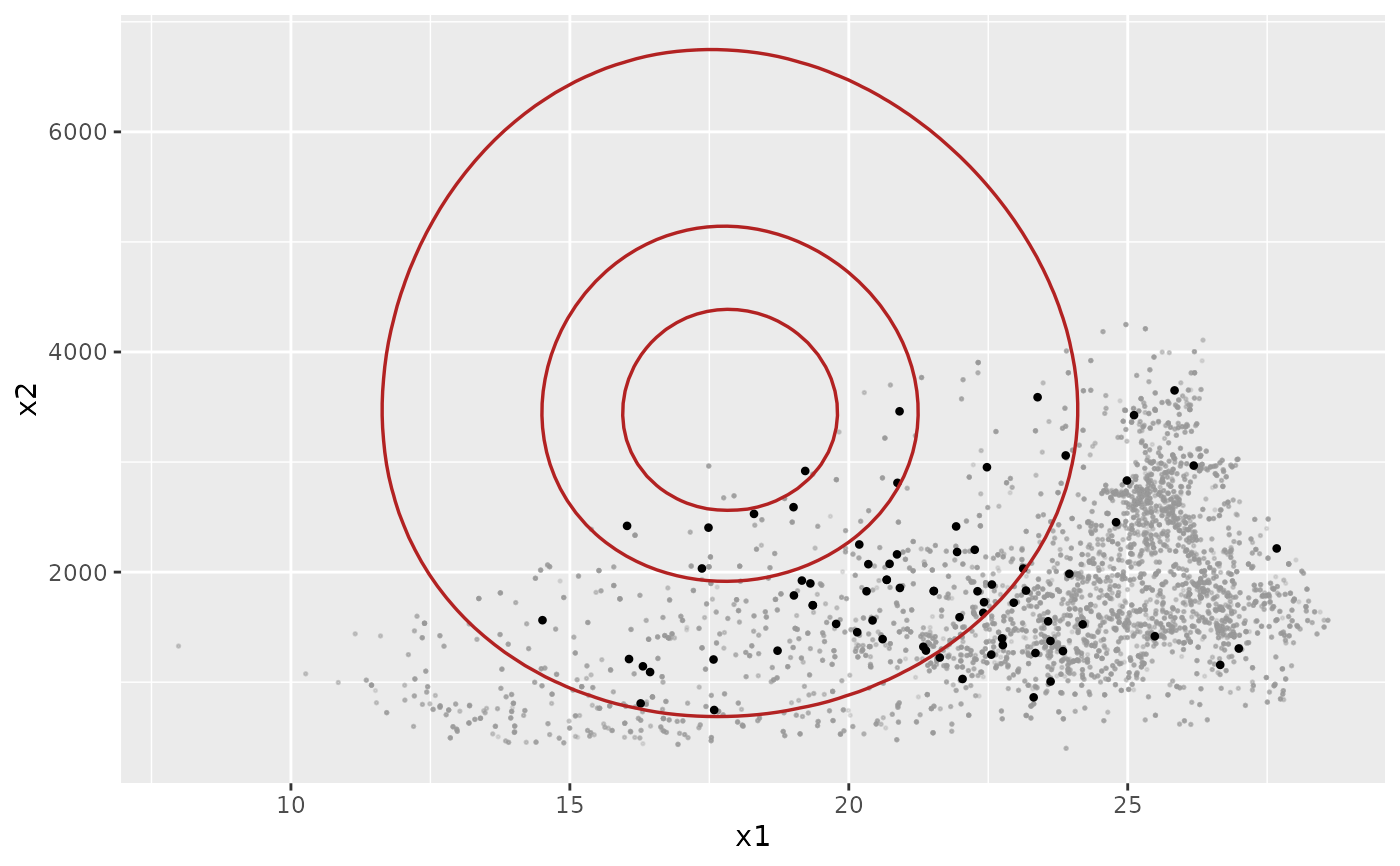
Iso-suitability contour layer derived from a fitted xnicher model
Source: R/geom_xnicher.R
geom_xnicher_isosuitability.RdBuilds a self-contained ggplot2 layer that draws iso-suitability
contours, i.e. level sets \(S(x) = c\) of the fitted niche
suitability function over a 2-D environmental grid. Unlike
geom_xnicher_ellipse, which traces analytical ellipses
and is therefore tied to the Gaussian (multivariate normal) niche
geometry, this layer evaluates the model's actual suitability
function on a grid and contours the result. It works correctly for
any likelihood family supported by optimize_niche(),
including the skew-normal families ("skew_normal" and
"skew_normal_weighted") where the iso-suitability sets are
not ellipses.
Usage
geom_xnicher_isosuitability(
  model,
  level = c(0.95, 0.5, 0.05),
  n = 121L,
  expand = 0.1,
  linewidth = 0.6,
  colour = "firebrick",
  ...
)
Arguments
- model
A
xnicherobject withlength(model$var_names) == 2(or, for legacy fits withoutvar_names, a 2-D fit).- level
Numeric vector of contour levels in \((0, 1]\). Default
c(0.95, 0.5, 0.05).- n
Integer grid resolution per axis. Default 121 (i.e. a 121 x 121 grid). Higher gives smoother contours at proportionally higher cost.
- expand
Numeric scalar in \((0, 1)\). The grid spans \(\mu \pm (1 + \mathtt{expand}) \cdot k \cdot \sigma_{\mathrm{eff}}\) along each axis, where \(k = 4\) matches the typical 4-sigma support of a Gaussian niche and \(\sigma_{\mathrm{eff}}\) is the marginal standard deviation. Default
0.1(10% padding).- linewidth
Path linewidth (or
sizeon ggplot2 < 3.4.0).- colour
Path colour.
- ...
Additional fixed parameters passed to
geom_contour.
Why "iso-suitability" and not just "ellipse"
For a Gaussian niche, the suitability function \(S(x) \propto \exp(-\frac{1}{2} (x-\mu)^\top \Sigma^{-1} (x-\mu))\) has elliptical level sets; the family of contours \(S(x) = c\) traces nested concentric ellipses around \(\mu\). For a skew-normal niche \(S(x) \propto \phi_2(x; \mu, \Sigma) \, \Phi(\alpha^\top \omega^{-1} (x - \mu))\) the \(\Phi(\cdot)\) factor breaks the ellipse symmetry: contours bunch on the side that \(\alpha\) pulls suitability toward, and stretch on the opposite side. The contour at level \(c\) is still a closed curve enclosing high-suitability environments, but it is no longer an ellipse and has no closed-form parameterisation. The only honest visualisation is to evaluate \(S(x)\) on a dense 2-D grid and contour the result – which is exactly what this layer does.
Suitability normalisation
Suitability is always normalised so that \(S(\mu^*) = 1\) at the
modal centre: for the Gaussian families that is the centre
\(\mu\); for the skew-normal it is the location parameter
\(\mu\) from the SN \((\mu, \Sigma, \alpha)\) parameterisation
(Azzalini & Capitanio 1999), which is generally not the
global suitability maximum but is a well-defined reference point.
The contour level level = 0.5 therefore always means
"regions where the niche is at least 50% as suitable as the
reference centre".
References
Azzalini, A. & Capitanio, A. (1999). Statistical applications of the multivariate skew normal distribution. Journal of the Royal Statistical Society, Series B, 61(3), 579–602.
Examples
# \donttest{
library(ggplot2)
fit <- optimize_niche(
env_occ = example_env_occ_2d,
env_m = example_env_m_2d,
num_starts = 5L,
likelihood = "skew_normal_weighted"
)
ggplot() +
geom_xnicher_background(example_env_m_2d) +
geom_xnicher_occ(example_env_occ_2d) +
geom_xnicher_isosuitability(fit)
 # }