Creates a Latin hypercube design based on the Sobol low-discrepancy sequence. This function provides an API-compatible alternative to the sobol_design function in the pomp-explore package for generating parameter designs.
Value
A data frame with nseq rows and one column for each parameter
named in lower and upper. Each column contains values scaled
to the specified range [lower, upper] for that parameter.
Details
This function generates a Sobol sequence in the unit hypercube [0,1]^d and then scales each dimension to the specified parameter ranges. The Sobol sequence is generated using the Joe-Kuo direction numbers with Property A enforcement, providing excellent low-discrepancy properties.
Following the recommendation of Joe & Kuo (2003) and the implementation in pomp-explore, this function skips the first k points of the Sobol sequence, where k is the largest power of 2 smaller than nseq. This improves the uniformity properties of the generated design.
The function is designed to be API-compatible with the sobol_design
function from the pomp-explore package, allowing for easy comparison and
drop-in replacement.
References
Bratley, P., & Fox, B. L. (1988). Algorithm 659: Implementing Sobol's quasirandom sequence generator. ACM Transactions on Mathematical Software, 14(1), 88-100.
Joe, S., & Kuo, F. Y. (2008). Constructing Sobol sequences with better two-dimensional projections. SIAM Journal on Scientific Computing, 30(5), 2635-2654.
See also
sobol_points for batch generation without scaling,
sobol_generator for incremental generation
Examples
# Generate 100 parameter sets for two parameters
design <- sobol_design(
lower = c(a = 0, b = 100),
upper = c(a = 1, b = 200),
nseq = 100
)
head(design)
#> a b
#> 1 0.0234375 182.0312
#> 2 0.5234375 132.0312
#> 3 0.7734375 157.0312
#> 4 0.2734375 107.0312
#> 5 0.3984375 144.5312
#> 6 0.8984375 194.5312
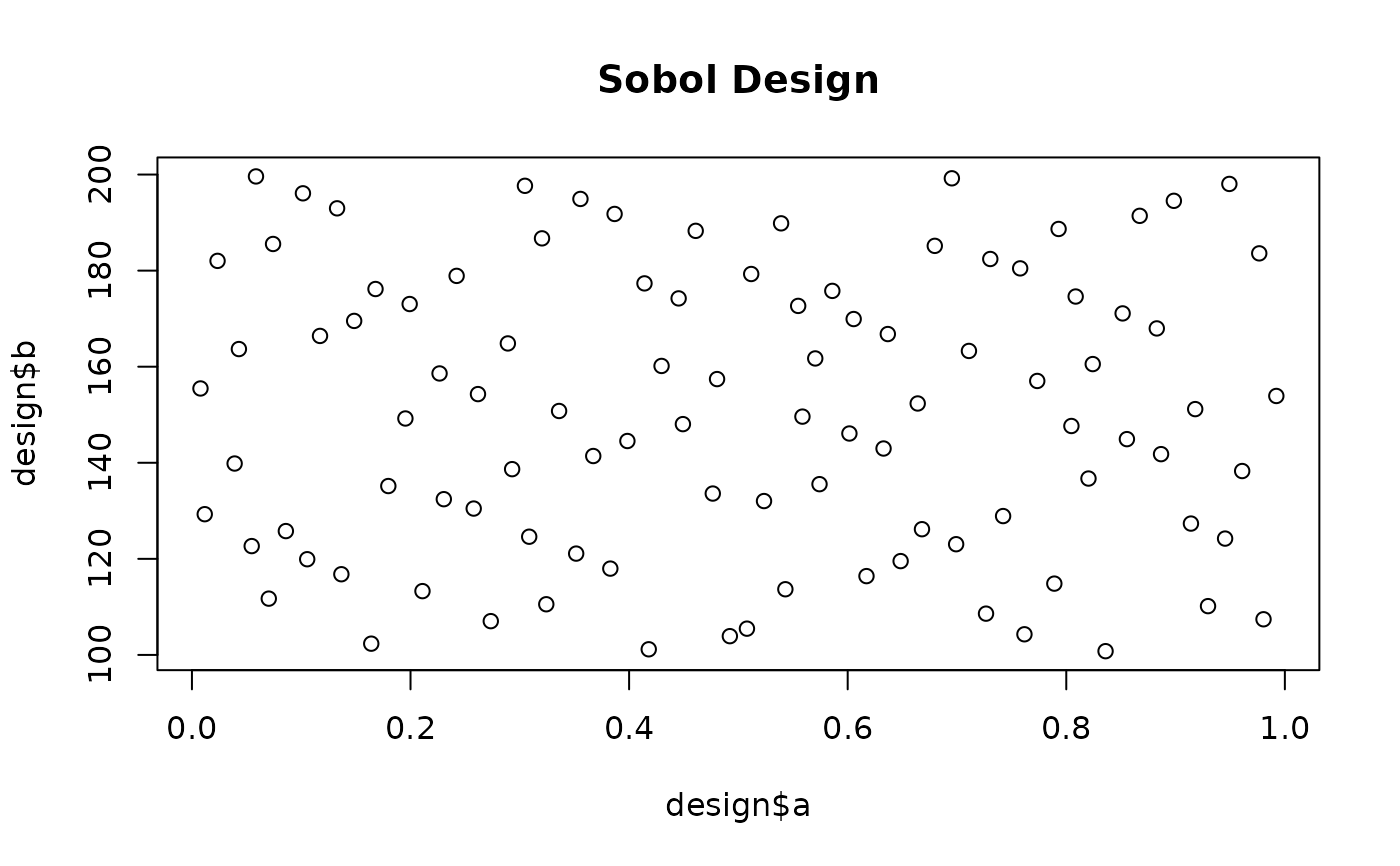
# Plot the design
plot(design$a, design$b, main = "Sobol Design")
 # High-dimensional example
params <- paste0("param", 1:10)
design_10d <- sobol_design(
lower = setNames(rep(0, 10), params),
upper = setNames(rep(1, 10), params),
nseq = 1000
)
# High-dimensional example
params <- paste0("param", 1:10)
design_10d <- sobol_design(
lower = setNames(rep(0, 10), params),
upper = setNames(rep(1, 10), params),
nseq = 1000
)