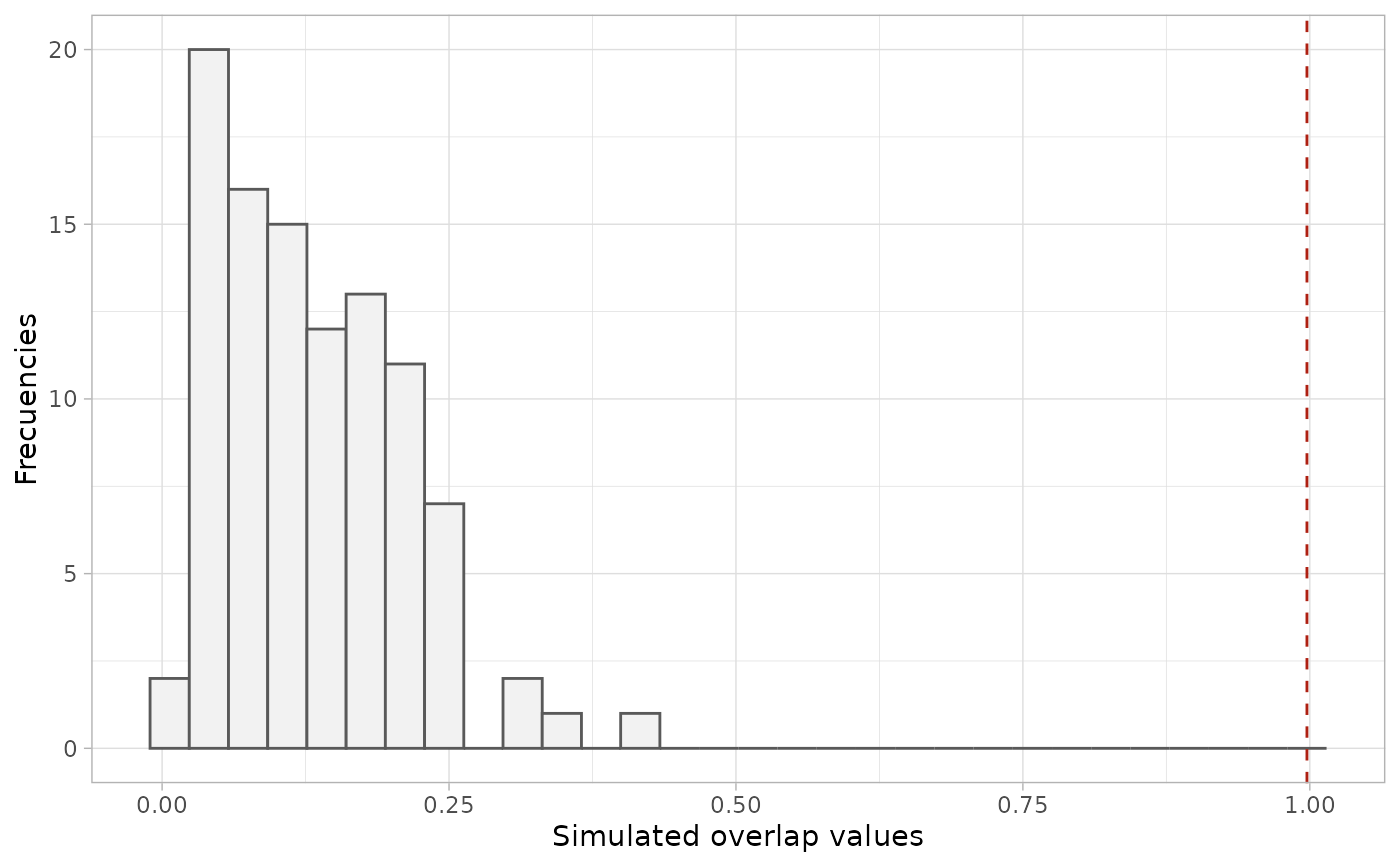
Plot null-model results for temporal niche overlap
temp_overlap_plot.RdCreates a histogram of simulated mean niche overlap values from a null model
(see get_null_model()) and overlays a dashed vertical line indicating the
observed mean overlap.
Arguments
- results
A list object returned by
get_null_model(), containingnull_niche_overlap(data frame of simulated overlaps) andobserved_niche_overlap(numeric observed value).
Value
A ggplot2 object displaying the null distribution of overlap values
with the observed overlap marked.
Examples
mod <- get_null_model(ex1, method = "pianka", nsim = 100)
temp_overlap_plot(mod)
#> `stat_bin()` using `bins = 30`. Pick better value `binwidth`.