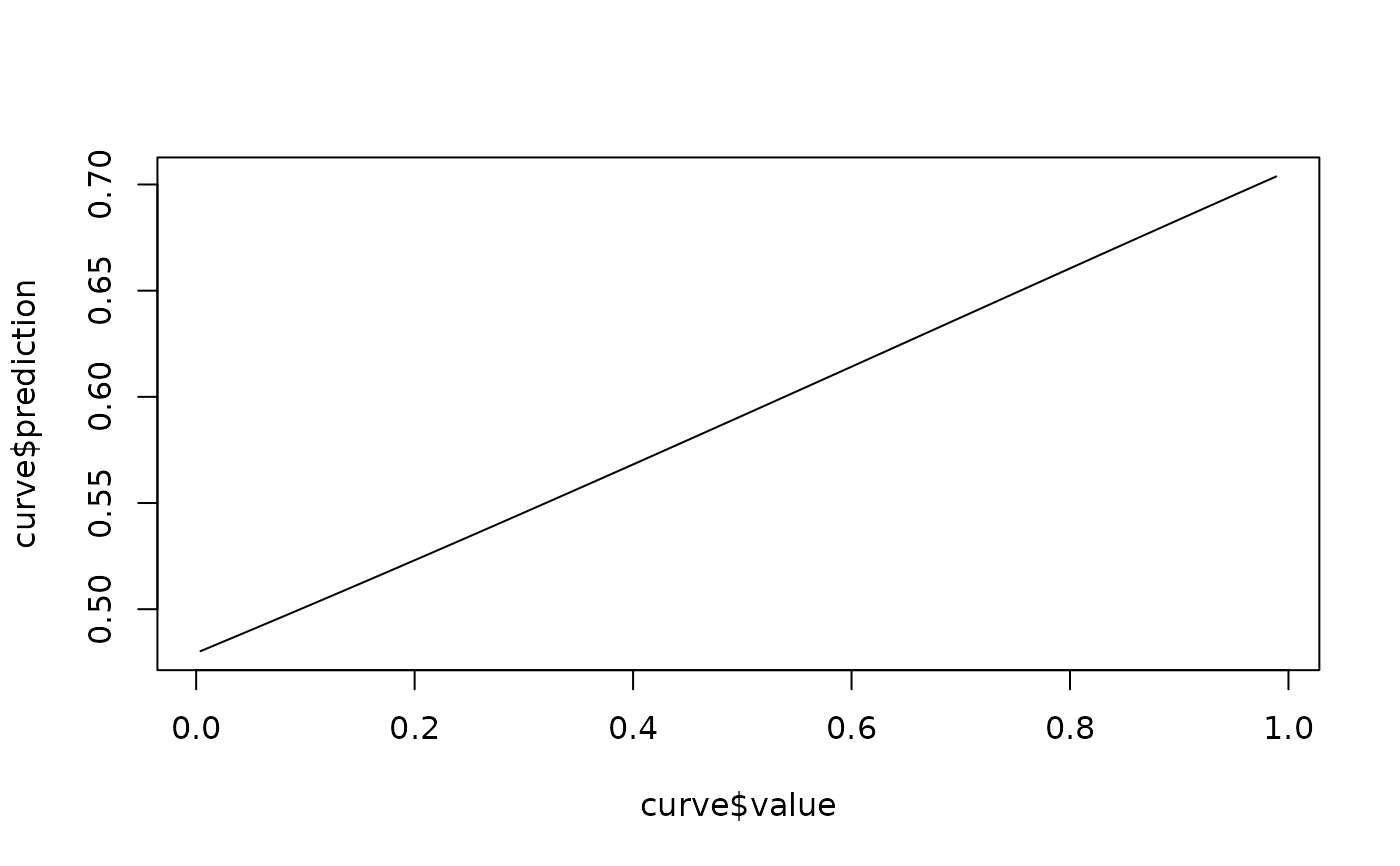
Generates a response curve by varying one environmental variable from its minimum to maximum value while holding all other variables at their mean. Applies the Java Maxent cloglog transform, matching the output of Java Maxent and dismo: $$cloglog = 1 - exp(-exp(H) \cdot raw)$$
Value
A data.frame with columns:
- value
Environmental variable value
- prediction
Cloglog-transformed prediction
Examples
# \donttest{
set.seed(42)
n <- 50L; idx <- c(5L, 15L, 25L, 35L, 45L)
env <- list(temp = runif(n), precip = runif(n))
feats <- maxent_generate_features(env, types = "linear")
model <- maxent_featured_space(n, idx, feats)
maxent_fit(model, max_iter = 100)
#> $loss
#> [1] 3.781356
#>
#> $entropy
#> [1] 3.887762
#>
#> $iterations
#> [1] 100
#>
#> $converged
#> [1] FALSE
#>
#> $lambdas
#> [1] 0.6202339 0.4108689
#>
g1 <- maxent_grid_from_matrix(matrix(env$temp, 5, 10),
        -120, 35, 1, name = "temp")
g2 <- maxent_grid_from_matrix(matrix(env$precip, 5, 10),
        -120, 35, 1, name = "precip")
curve <- maxent_response_curve(model, list(g1, g2),
           c("temp", "precip"), var_index = 0)
plot(curve$value, curve$prediction, type = "l")

# }
# }